Data is like a vast set of building blocks, each has different shapes, sizes, and colors. Just like each brick has its unique utility, every piece of data carries a unique piece of information.
As a business owner, how can you possibly start understanding what all the pieces of data from those fancy reports mean? We can help.
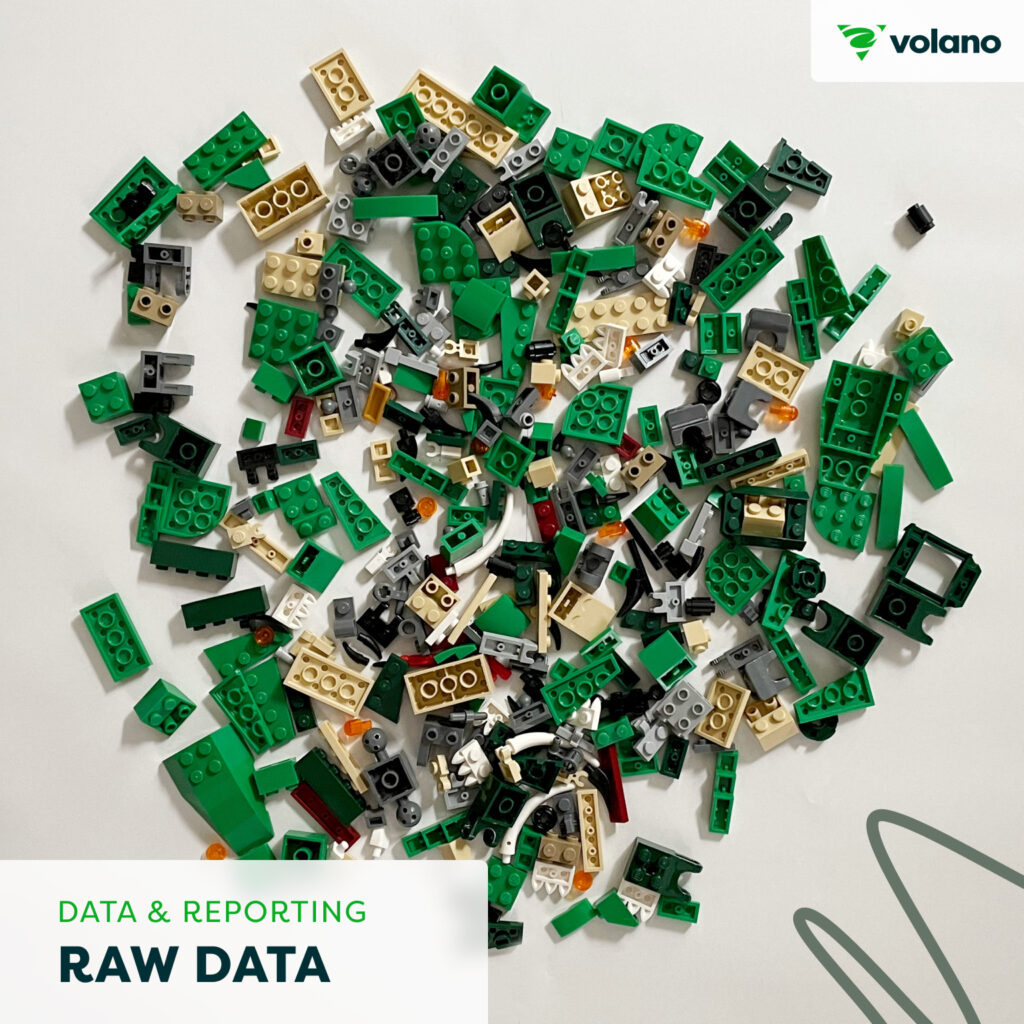
01 Raw Data
In its raw format, data can be confusing, and difficult to understand. Finding patterns or removing outliers is also challenging. This is why filtering, sorting, and arranging the data is needed.
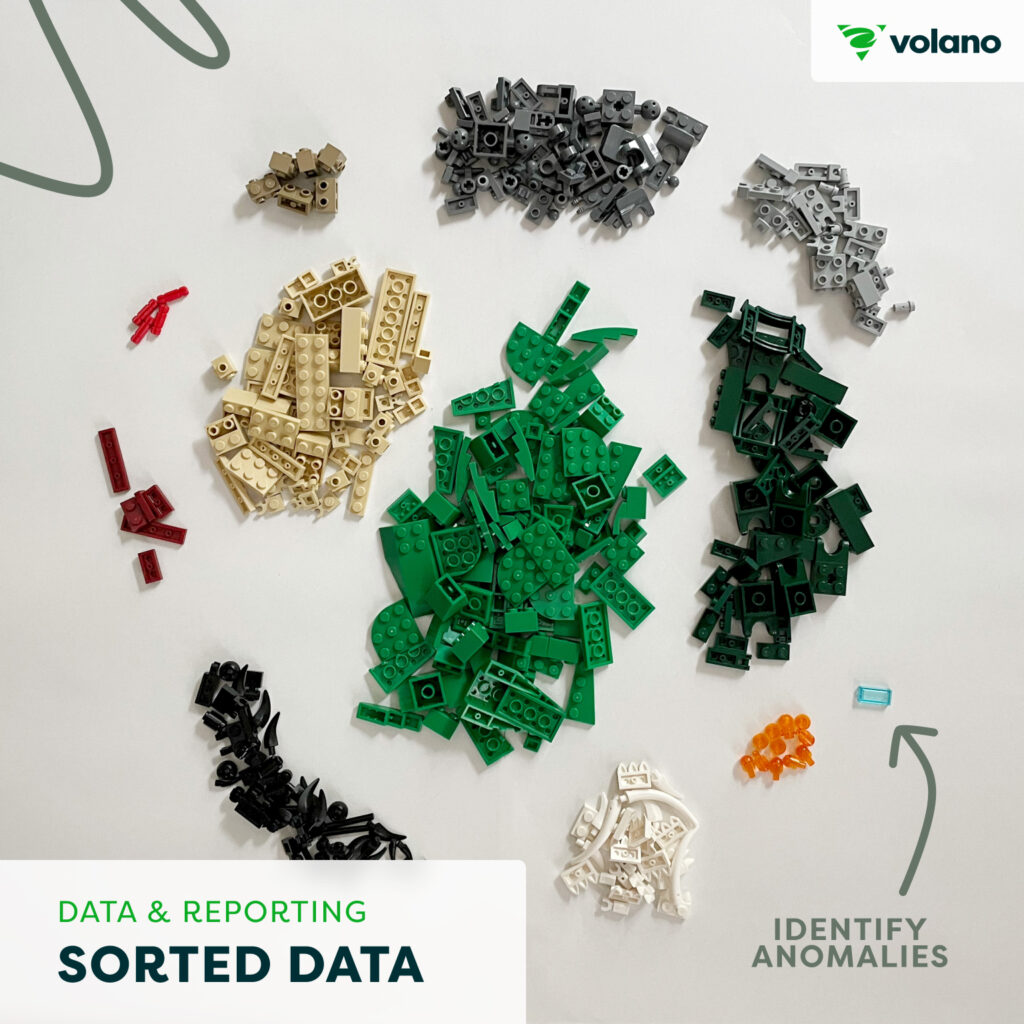
02 Sorted Data
Can start to inform the business. Anomalies can be found and patterns begin to emerge.
However, reporting on this type of data still has its difficulties.
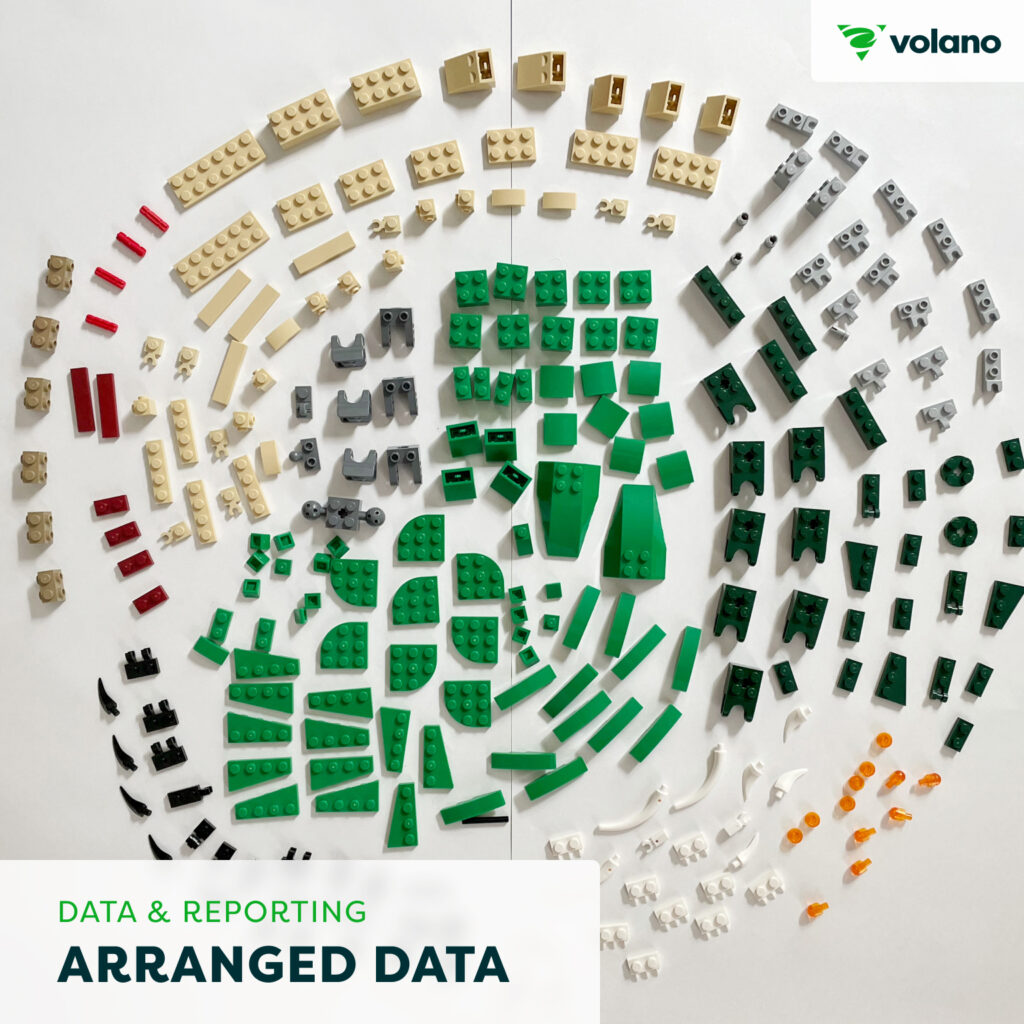
03 Arranged Data
As a business, this type of sorting and arranging can assist each department in understanding its role in the business as a whole. You can begin to identify shortcomings and strengths in how you produce goods and services.
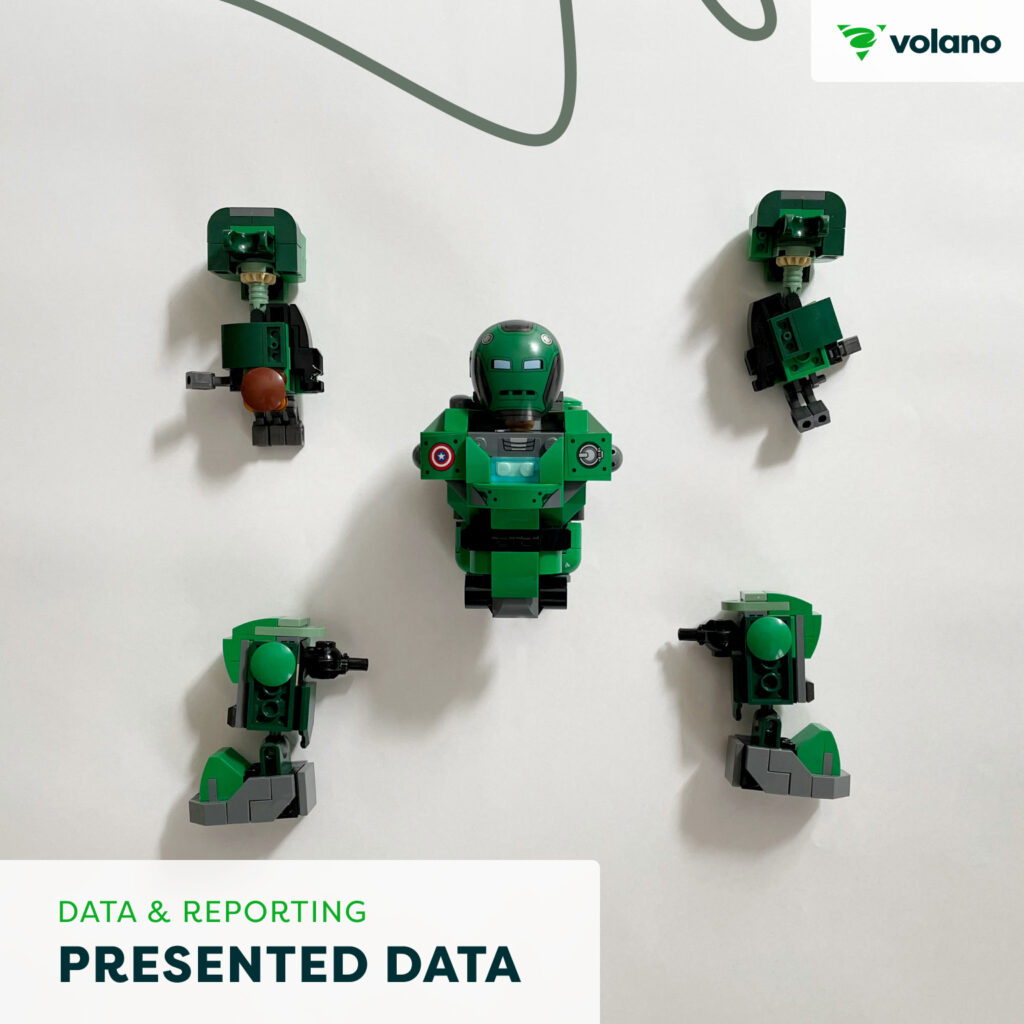
04 Presented Data
When you present your business’s data visually (charts, graphs, etc.), it improves comprehension and you can easily recognize patterns. This helps to highlight and focus on the key metrics that matter most.
05 Storytelling
If you want action in your business, build data into compelling narratives. The goal is not to simply inform, but rather to persuade and motivate movement. When you tell stories it improves engagement and memory retention.
Key Takeaway
Use data storytelling to motivate action. Overall it improves retention and engagement. Don’t simply report on data, look for patterns that help guide decision-making. Thanks for reading!
Want more great content like this? Sign up for our not-boring newsletter.